The Continuum of Natural Disasters Maps and Data ResourcesNSGIC's “Continuum of Natural Disasters” project was designed to raise awareness about the nature, type, and frequency of federally-declared natural disasters and how geospatial data can improve government efforts to plan for, mitigate and respond to these events. There are three basic products associated with this project – Interactive Maps, a White Paper, and a geospatial Data Matrix This document discusses Maps and Data Resources. Click here to view the home page for this product and to access the other products. Maps and Data Resources
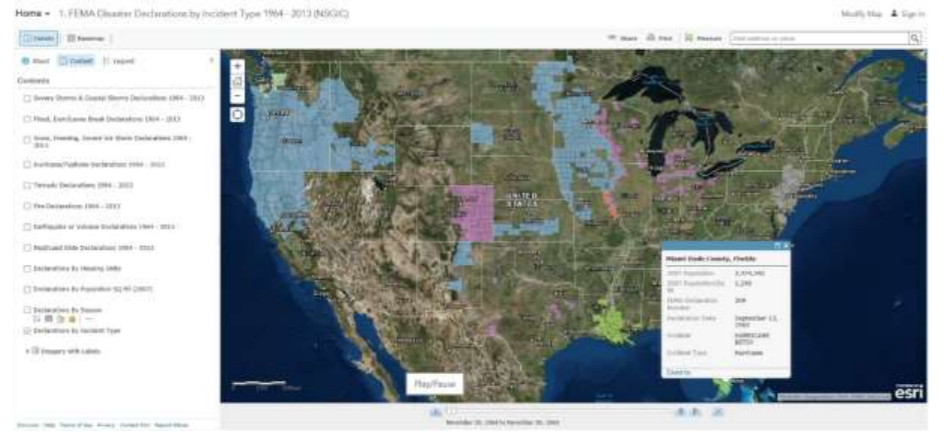
Since the project was first envisioned, a number of new Open Data and GIS Services that provide comparable data sets, services and APIs have been identified by NSGIC that use this Presidential Disaster Declaration data. These NEW disaster declaration data resources have been published by other organizations including FEMA, NOAA, and several Non-Profit organizations. These new resources have dramatically expanded the options to query, analyze and visualize Historic and Current disaster declarations. Additionally, several new disaster declaration data studies and social media resources have been published by USGS, APA, ASFPM, NADO, NIBS, NIST, The Whitehouse, Esri, and several nonprofit organizations which have expanded the information available and added communication and collaboration options for this project. As this is a quickly evolving topic, we have done our best to incorporate these new sources in our project understanding, development and deliverables, including the Maps. More than one map or geospatial data layer is needed to tell this story. We identified a set of existing FEMA data resources to use as authoritative sources of information on this topic, including geospatial data files, web services, and open data APIs that access available FEMA Federally-declared natural disaster data in the United States available from 1964 to 2014 (through 2013). This information can be viewed using interactive online mapping technology to better understand the nature, extents and impacts of natural disasters. In the remainder of this document we will first discuss the new maps published on NSGIC’s ArcGIS Online Mapping Platform, followed by a discussion of the other available resources that we identified during the development of this project. We will conclude with a discussion of the source data resources that were both evaluated and used in the final section. New MapsFEMA’s Federally-declared Natural Disaster Declaration data can be best viewed using interactive online mapping technology to help visualize and better understand the nature, extents and impacts of these events. NSGIC’s Continuum of Natural Disasters Project Home PageTo help tell this story, NSGIC developed three distinct interactive maps on our organization’s ArcGIS Online Mapping Platform https://nsgic.maps.arcgis.com. NSGIC’s Continuum of Natural Disasters page is this project home, and provides access to all of the project reports, maps and other products developed and referenced. nsgic.org/continuum-of-natural-disasters 1. FEMA County Disaster Declarations by Incident Type 1964 - 2013 (NSGIC)
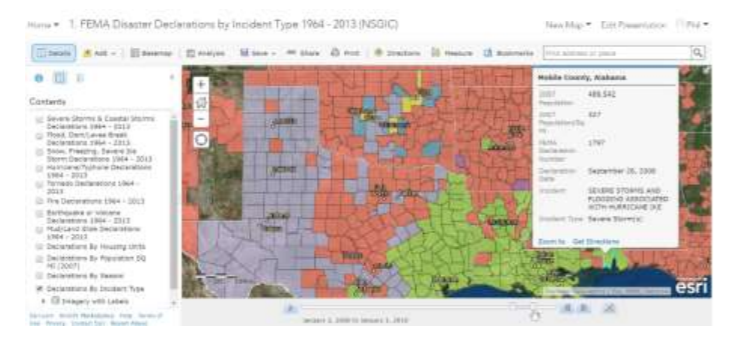
This map includes 29,877 unique records by U.S. County for all Federal disaster declarations between 1964 and 2013. Each Individual map layer is time-enabled, allowing data to display by user-selected years, as well as animating the display of each layer through time (see bottom of the map display screen timeline controls).
Users can also display and query data by any combination of Types of Incidents, their occurrence by Season, impact on population per square mile, impact on the number of Households, and impact of Farming based on agriculture sales per county. The custom pop-up attribute display includes basic incident and historic census population estimates for reference.
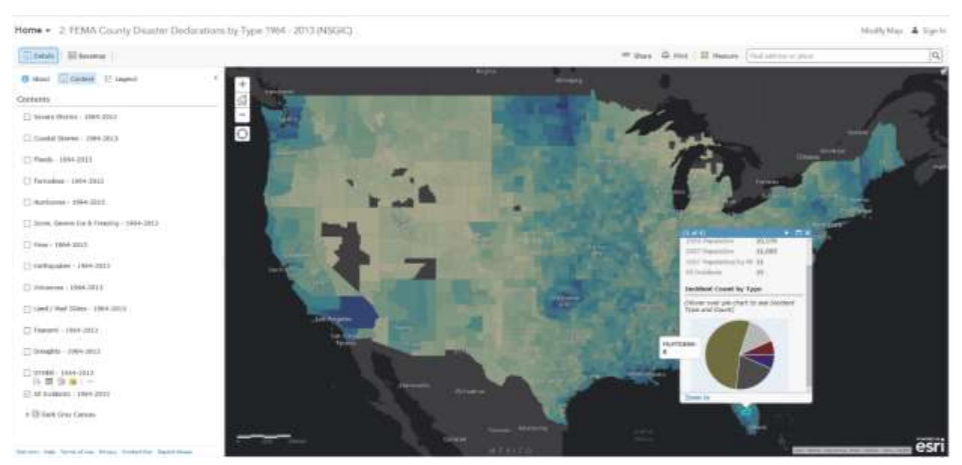
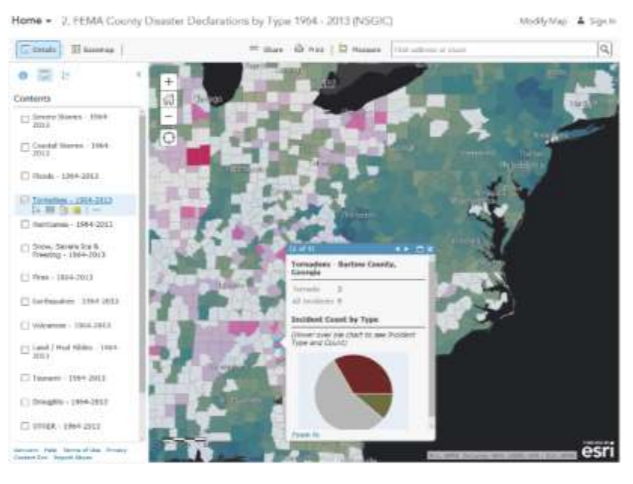
2. FEMA County Disaster Declaration Incident Summary 1964 - 2013 (NSGIC)
This map includes 3,141 unique records [one per U.S. County] reporting all Federal disaster declaration incidents between 1964 and 2013 by county. [Note: This data is not time enabled.] The base layer [shades of blue] symbolizes the total number of declarations for each county between 1964 and 2013.
Custom Pop-up attribute display includes incident counts by type.
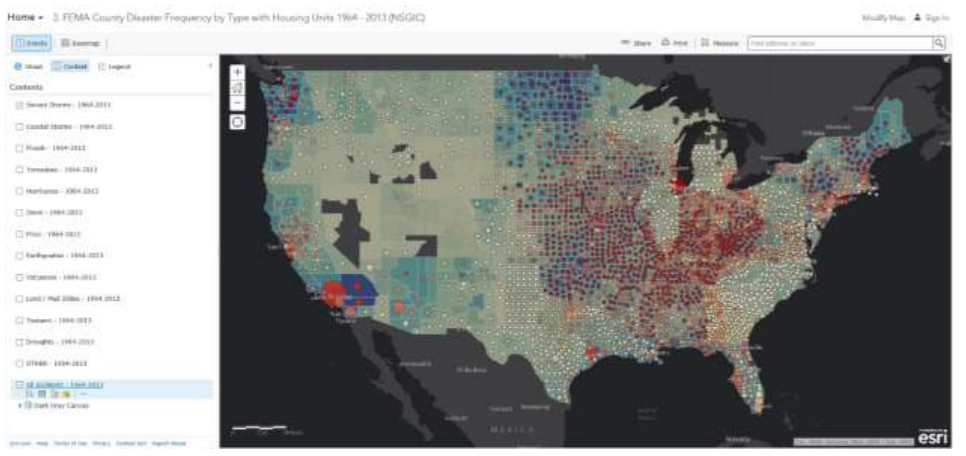
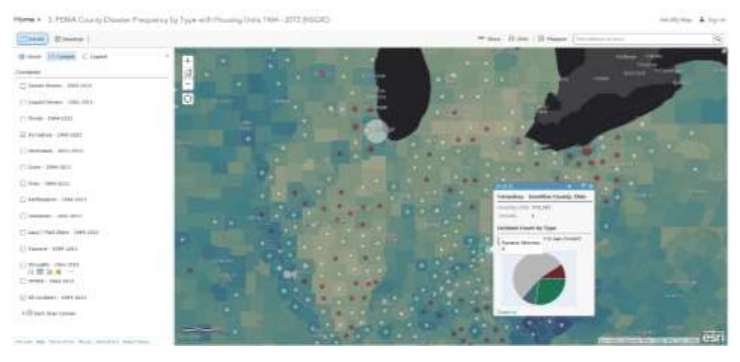
3. FEMA County Disaster Frequency by Type with Housing Units 1964 - 2013 (NSGIC)
This map includes 3,141 unique records [one per US County] reporting all Federal disaster declaration incidents between 1964 and 2013 by county. [Note: This map uses the same data and base layer as Map 2 and is not time enabled.] Like Map 2, the base layer [shades of blue] symbolizes the total number of declarations for each county between 1964 and 2013. The additional map layers breakout incidents by type with the size of the circle reflecting the number of housing units in the county, with the shading heat ramp depicting the total number of incidents per county between 1964 and 2013. The figure below shows the distribution and number of Tornado declarations displayed over the base of all declared incidents. Although using the same data as Map 2, this map illustrates the potential impact of these incidents on homes.
NOTE: Each of these maps is shared with everyone (public) on ArcGIS.com so these maps can be used as is, or copied, edited, and used in a custom GIS application to meet any custom end-user need. Other Available ResourcesThe following new resources are also highly recommended for users who need more in-depth access and analysis to both historic and current disaster declaration data. These interactive maps and tools allow users to view, query, isolate, summarize, report, download and better understand the nature, extents and impacts of federally-declared natural disasters through a series of interactive steps. FEMA - Open FEMA Data Visualization - http://www.fema.gov/data-visualization
NOAA Billion-Dollar Weather and Climate Disasters: Mapping - http://www.ncdc.noaa.gov/billions/ 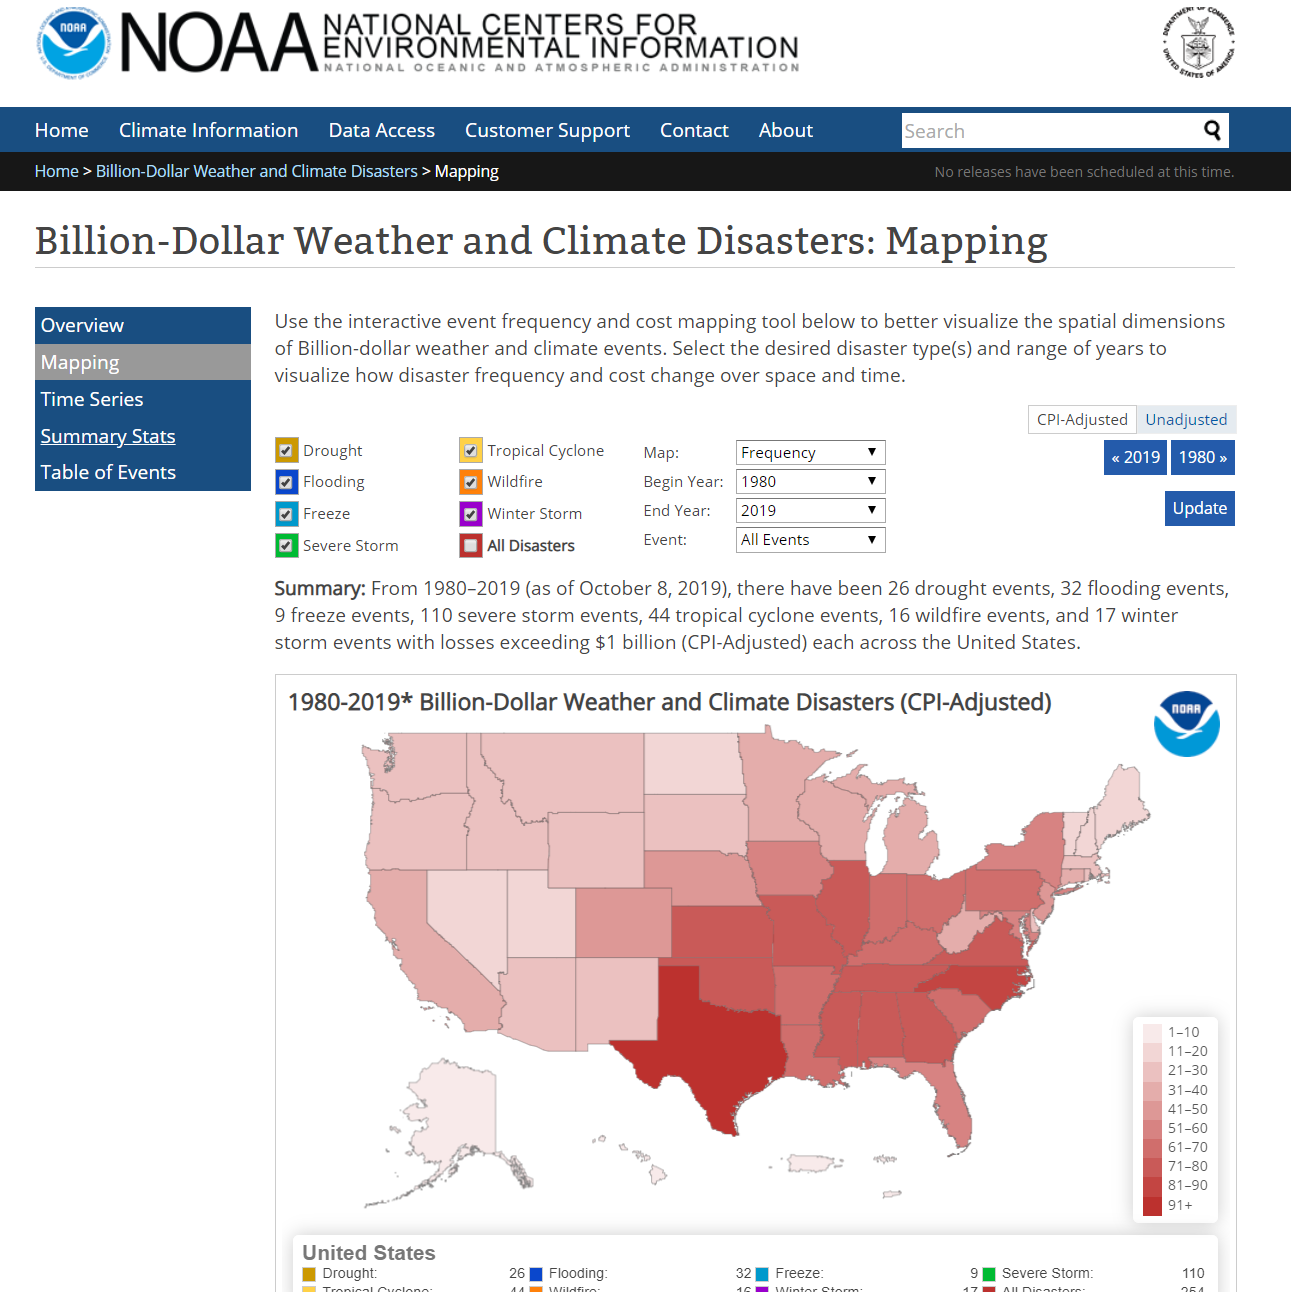
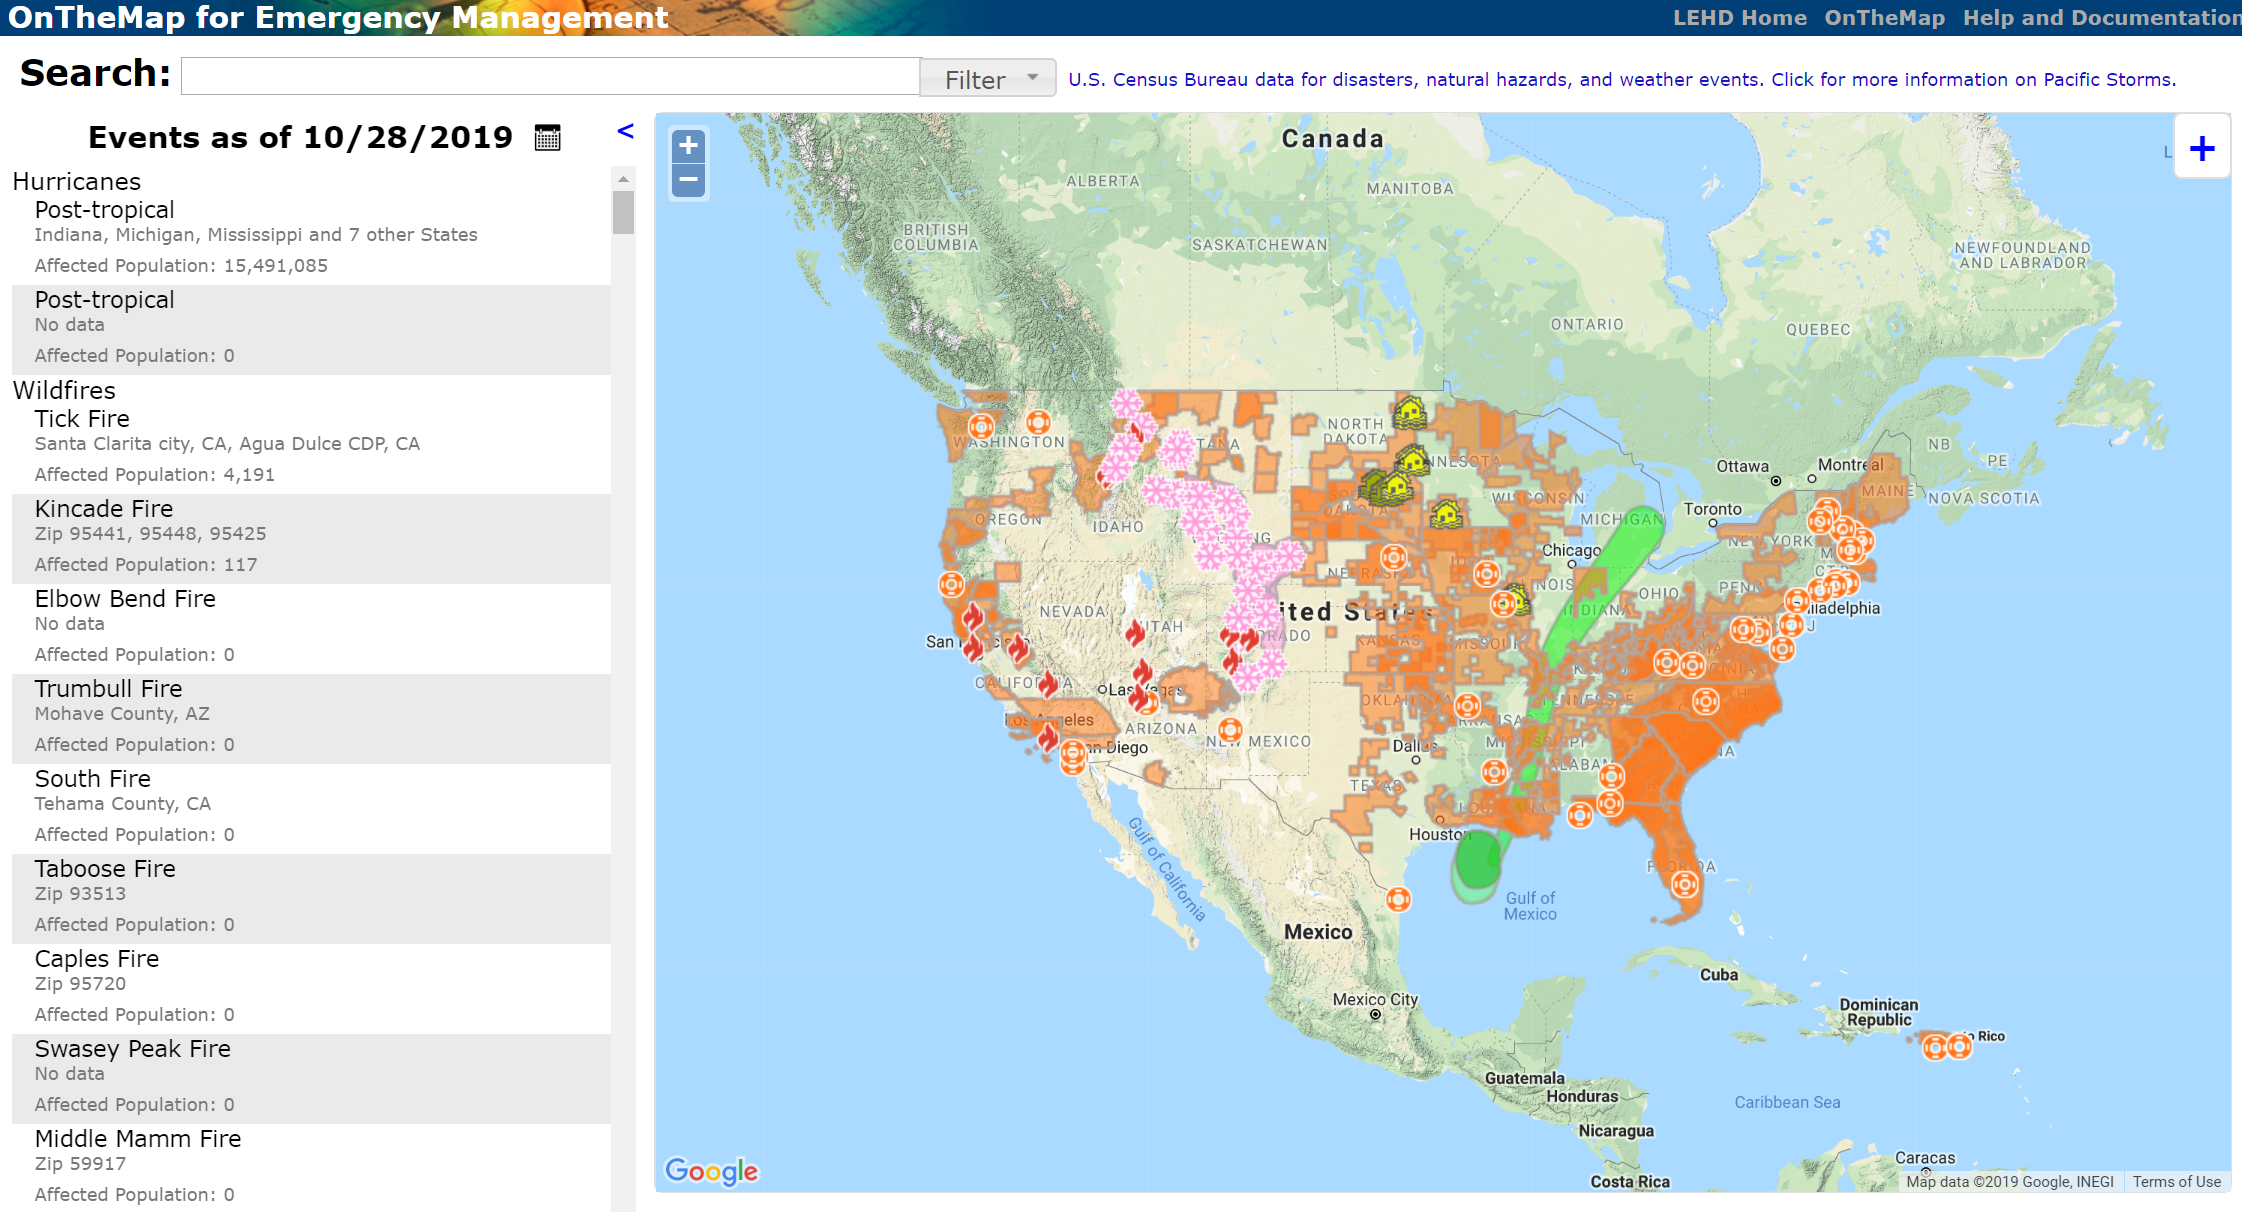
From 1980–2015, there were 23 drought events, 22 flooding events, 7 freeze events, 75 severe storm events, 34 tropical cyclone events, 13 wildfire events, and 14 winter storm events with losses exceeding $1 billion (CPI-Adjusted) each across the United States. To better visualize the spatial dimensions of billion-dollar weather and climate events, below is an interactive event frequency mapping tool. This interface provides a customizable range of years and disaster types, to help visualize how disaster costs change over space and time. A dynamic summary of the billion-dollar disaster events is also refreshed as the map selection is updated. U.S. CENSUS Bureau – OnTheMap for Emergency Management - https://onthemap.ces.census.gov/em
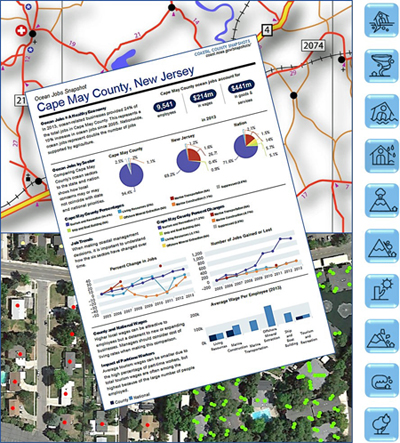
OnTheMap for Emergency Management provides real-time access to a range of detailed U.S. Census Bureau data about the people living and working in areas being affected by hurricanes, floods, wildfires, winter storms, and federal disaster declaration areas.
Other Resources:
Data ResourcesFEMA Data Description: FEMA Disaster Declaration Data depict Presidential Disaster Declarations from 1964 to 2014. These data provide a geospatial view to the Robert T. Stafford Disaster Relief and Emergency Assistance Act (referred to as the Stafford Act - 42 U.S.C. 5721 et seq.). The Stafford Act authorizes the President to issue "major disaster" or "emergency" declarations before or after catastrophes occur. Emergency declarations trigger aid that protects property, public health, and safety and lessens or averts the threat of an incident becoming a catastrophic event. A major disaster declaration, issued after a catastrophe occurs, constitutes broader authority for federal agencies to provide supplemental assistance to help state and local governments, families and individuals, and certain nonprofit organizations recover from the incident. This data is compiled and distributed by FEMA Mapping and Analysis Center (MAC). FEMA Data Download: FEMA has historically provided access to Presidential Disaster Declaration data for download in tabular (.csv/.xls) format, Esri Shapefile (.shp) format, and Esri REST Service for use with GIS / CAD software. http://gis.fema.gov/DataFeeds.html Note: These data were downloaded and used to create the NSGIC maps. (See the NSGIC Published Data section below for more details.) FEMA REST Services: Parent Resource Folder: http://gis.fema.gov/arcgis/rest/ FEMA Open Data Visualization API: Most recently, FEMA now makes these data along with much more detailed Presidential Disaster Declaration data available through an Open FEMA API. http://www.fema.gov/data-visualization NSGIC Published Data NSGIC had initially planned to use the FEMA REST Services to develop its new interactive maps versus downloading the source data to avoid creating a snapshot of this data map that would need to be manually refreshed when FEMA updates their services. The REST Services maintained by FEMA GIS and are updated on an annual basis to provide an updated snap shot of historic disaster declarations over time. Upon reviewing these various FEMA data sources for federal disaster declaration data and from discussions with FEMA GIS staff it was determined that the current FEMA REST services were being filtered, and currently did not provide access to all declaration data available through download from the Open FEMA APIs. As a result, to support our mapping needs, NSGIC downloaded a snapshot of these data from the API and published our own data Service Definitions and Feature Layers on NSGIC’s ArcGIS Online Mapping Platform to create the unfiltered Feature Layer Services we needed to support our mapping needs of the FEMA Federally Declared Disaster data. Note: These data were downloaded and used to create the two Feature Layers published to support these maps. FEMA Data Citation: Data for this project was downloaded from FEMA in April 2016 and reflect the data available at that time using the available APIs. This product uses the Federal Emergency Management Agency’s API, but is not endorsed by FEMA. FEMA cannot verify the quality and/or timeliness of any data or any analysis derived therefrom after the data have been retrieved from FEMA.gov. NSGIC Data Citation: Disclaimer: All information is provided as-is, and with no warranty for content, accuracy, usability, or suitability for use. This project uses existing FEMA data resources that are the authoritative sources of information on this topic, including geospatial data files and open data APIs that were used to access available FEMA Federally-declared Natural Disaster data in the United States available from 1964 to 2014 (through 2013). Note: These original data sources reflect a variety of inconsistencies and completeness is data collection, as well as changing definitions and priorities in FEMA’s disaster declaration information collection since record-keeping began in 1964. The original data was not modified. To publish the new Feature Layers on ArcGIS Online, NSGIC joined the FEMA Natural Disaster data with an Esri US County polygon shapefile and included the available county population and demographic attributes from the U.S. Census Bureau’s American Community Survey. A significant portion of the available attribute data is not displayed in the NSGIC interactive maps, but is accessible through the site by experienced users. More recent data may be available from the original sources. [NOTE: GIS Staff at FEMA are currently discussing removing these limitations from the current REST services, potentially by creating new REST service(s) for Federal declaration data that are not filtered and access all of the data available in their new OpenFEMA API. If this service becomes available in the future, NSGIC will consider using these new REST services to create a more data-rich and integrated ArcGIS.com Map/App solution.] LinksView NSGIC’s Continuum of Natural disasters home page. Find more information about NSGIC's Geospatial Resiliency Task Force. Find more information about NSGIC's Geospatial Preparedness Committee. |
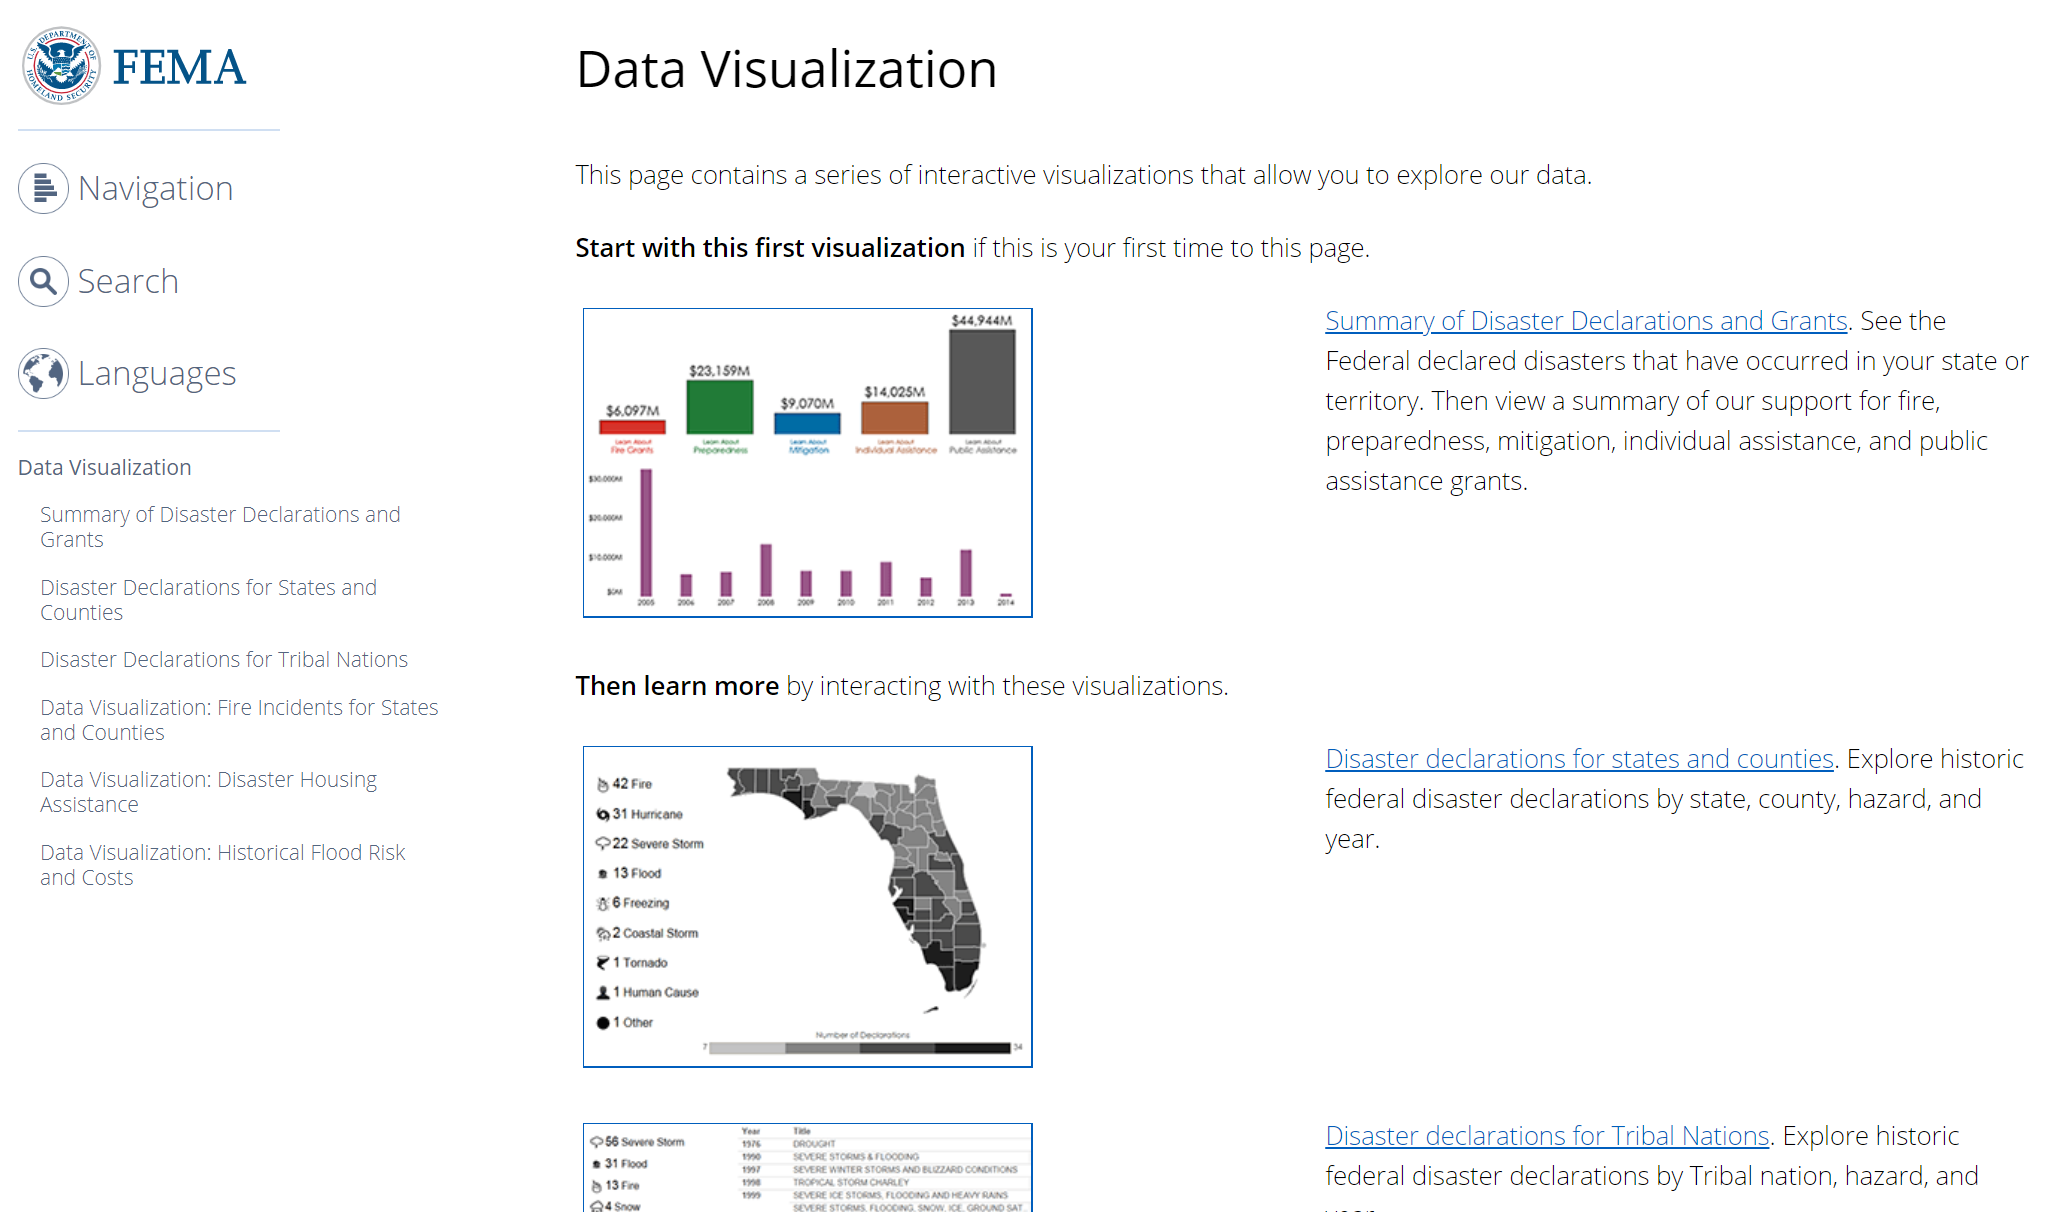 The new Open FEMA visualization web site is a tremendous tool to access the details of any historic disaster declaration. Although map visualization is limited, the ability to interactively drill down into the declaration data details is powerful.