
The Continuum of Natural Disasters ProjectBackgroundNSGIC's Continuum of Natural Disasters project was designed to motivate government agencies at all levels to share data and to partner on the creation of the geospatial data required to effectively prevent and manage natural disasters. You might be surprised to know that the same types of geospatial data required by emergency managers and call-takers at 9-1-1 centers are often the same data used on a daily basis by planning, permitting, public works, and other agencies. Developing data to meet the most stringent requirements and effective data sharing are some of the keys to success when dealing with natural disasters. Raising awareness about the nature, type, and frequency of federally-declared natural disasters can also improve government efforts to plan for, mitigate, and respond to these events. The report, spreadsheet, maps, and other resources accessed from this page provide a gateway to free geospatial resources that support government resiliency efforts. The following chart helps us understand the impacts associated with natural disasters over the past 35 years (1980 to 2014). The frequency and costs associated with major disasters have increased by 350% over this period. 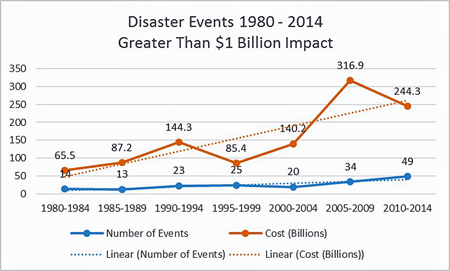
Report
Data MatrixThe data matrix is included in Appendices 3 and 4 of the report with a complete explanation of how it was created. It identifies the types of geospatial data routinely used by all government agencies and the operational data used mostly by emergency managers and first responders. The matrix relates each of these data layers to 15 types of natural disasters. It also indicates public sources for these data in the last column according to a key located in the spreadsheet and in Appendix 2 of the report. The matrix is provided separately as an Excel spreadsheet to facilitate the use of this information. Maps, Apps and DocumentationNSGIC developed three new online maps using the federally-declared natural disaster data from 1964 to 2014 for all 50 States that is produced by the Federal Emergency Management Agency (FEMA). These interactive maps are published on ArcGIS Online and are designed to characterize the nature, type, and frequency of federally-declared natural disasters. Published AppsThe new maps are used to create and publish custom Applications for novice users and experts to quickly and easily view and interact with the disaster declaration information. The following map viewing Applications are currently available. FEMA Disaster Timeline App | FEMA Disaster Type App | FEMA Severe Storm App The Applications above are just a few examples of how this disaster declaration data published through the Maps below can be leveraged to create multiple views of this data. The Timeline App above allows users to view results of almost 30,000 disaster events since 1964. The Disaster Type App allows users to interact with FEMA's historic disaster declaration summary data separated into 13 different layers by incident type. Finally, the FEMA Severe Storm App provides a detailed view of the frequency and location of these types of incidents combined with the Counties Census Bureau Housing data to better illustrate the human impact. These three Apps are intended to be both useful tools, and to simply provide a few examples of what can be done to improve the utility and understanding of the Published Maps. We invite the user community to create additional Apps for the Published Maps, and to share them back to us for inclusion on our site. Community contributions will be shared on the NSGIC Resiliency Task Force Library page (see link in the NSGIC Resources section below). Published MapsThe three interactive maps allow more experienced users to view all disaster events, or to choose particular types of disasters from 1964 to 2014. They also allow users to view the maps in any time sequence, understand these events by geographic and seasonal impacts, and identify impacts on populations and housing. These maps and the data collected to create them are all freely available to use as is, or to copy and customize to make your own interactive maps and apps using ArcGIS Online with your own data. Disaster Chronology | Disaster By County | Disaster Impact on Housing Documentation and Published DataWhile developing these new maps, we identified a number of related online disaster data resources and interactive maps published by FEMA, NOAA, and others. The descriptions and links to these resources provide additional information and data analysis tools to support further exploration, and to gain a broader understanding of the increasing frequency, severity, and cost of federally declared natural disasters. It's important to remember that the disaster events included in these data and maps do not include state-declared natural disasters, which have a significant local impact, but did not qualify for federal declarations. NSGIC ArcGIS Map Help | NSGIC Data: FEMA Declarations County Summary | NSGIC Data: FEMA Declarations County Details View the Continuum of Natural Disasters Maps and Data Resources page ContributorsNSGIC appreciates the expertise of the following individuals from our Geospatial Preparedness Committee, Resiliency Task Force, FEMA, NOAA, Esri and other organizations who assisted us in this project.
Project FundingThis material was prepared by the National States Geographic Information Council (NSGIC) with funding assistance from the National Oceanic and Atmospheric Administration (NOAA) under Contract No. EA133C-11-CQ-0010. NSGIC served as a professional services subcontractor to Woolpert, Inc. to develop these products and NSGIC is solely responsible for their content. DisclaimerAll information is provided as-is, and with no warranty for content, accuracy, usability, or suitability for use. |
 Many previous efforts have been undertaken to identify the essential geospatial data that are required for disaster related functions. NSGIC assembled an expert panel from the emergency management community to collect information on these past efforts, and to work with its Resiliency Task Force and Geospatial Preparedness Committee to harmonize these efforts. The Panel produced a list of required data by disaster type in a matrix format that also provides links to free sources for many of the data layers. The report discusses how local, state, tribal, and federal agencies can most effectively work together to create these data, or license them from commercial sources. It also provides real-world examples of tangible cost savings and intangible benefits for each of the examples cited.