GWU Counting for Dollars, Census-Informed Federal Program FundsBy Bert Granberg | September 18, 2017 At least a couple times a year, state GIS offices are apt to encounter some mention of the importance of the Census Bureau having the best possible GIS roads and address data from their state, as the Bureau prepares for its next decennial census count.
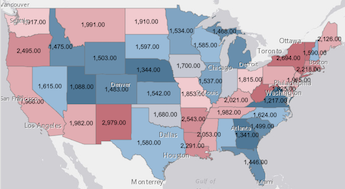
Last month, Professor Andrew Reamer of the George Washington University Institute of Public Policy, published an analysis of 16 large federal programs that utilize Census-derived datasets to set state funding levels, with details on the methodology used, and (a drum roll please), specific data for each program and state. In the study, titled Counting for Dollars 2020: The Role of the Decennial Census in the Geographic Distribution of Federal Funds, the per capita totals across the 16 programs that were examined were certainly not linear with respect to population, ranging from a high of $4,583 (DC) to a low of $1,086 (UT, what?!) with a national average of $1,838 (US). This is important work as it ‘daylights’ supporting info for those anecdotal mentions that tie federal funding to complete count efforts and thereby the importance of building and sharing complete, up-to-date GIS data with Census in a manner that will best coincides with the preparation and field work for 2020. It is recommended that you be very careful in making conclusions about this data and take time to understand the methods (project slides ) and notes, including this disclaimed warning for the per capita state totals: "It does not indicate the amount by which federal funding increases for each additional person counted."
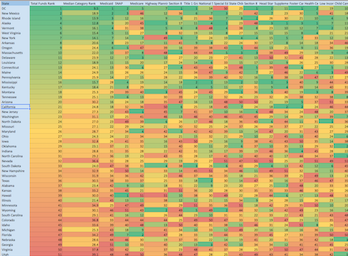
In the interactive map, you can use the 'Filter' and 'Change Style' functions below the layer name (left side map nav) to view any of the 16 program funding categories. In the Google spreadsheet, total funding, per capita funding, and state rank are provided for each of the 16 programs. These different views into the data are accessible from the 'Sheet' tabs at the bottom left of the doc. The per capita numbers in the tables and maps may be slightly different that what is presented by GWU, likely to due to rounding issues. This is very interesting data. It's hard not to explore the funding ranges and disparities, by state, and by program. In addition to population, socio-economic factors like age, household income and composition are clearly playing a role. State adoption of Medicaid expansion under the ACA is probably also a very significant factor in the overall totals and ranks. And, the geographic size of a state's road network relative to its population certainly looks to be a factor for federal highway funding. Special thanks to our AGRC intern and University of Utah student, Emerson Pratt, for compiling the spreadsheet view of the GWU data.
|


