
Sponsor Spotlight: makepathEquip Your GIS Analysts with Easily Scalable Tools By makepath | March 5, 2021 In this post, makepath will spotlight two tools that are great because they scale well, especially as the scope of a project grows. Scalability is gold in the GIS world. Xarray-Spatial
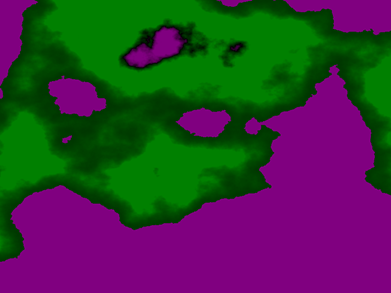
Xarray-Spatial is a spatial processing toolbox for GIS professionals. It is an open source GIS Python library for raster analysis that is easy to install and extend to apply to different GIS scenarios and use cases. In the GIS world, rasters represent continuous phenomena such as elevation, rainfall and distance, directly as numerical values or as RGB images created for humans to view. Why We Made it Open Source? At makepath, we believe open source software propels innovation in the industry. Open source tools are free, community-driven, and encourage innovation by empowering users and contributors to suggest products and features. Below is an overview of a few use cases for Xarray-Spatial. What Can We Learn from Satellite Data? multispectral.pyWith the multispectral tool, users can analyze the wavelengths of images with different multispectral band indices. Some examples include:
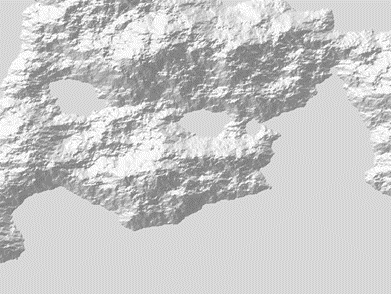
HillshadeThe hillshade tool allows users to analyze terrain by assigning an illumination value to each cell, based on a specific azimuth and altitude. A simple Digital Elevation Model (DEM) can be transformed into a shaded relief map to highlight the actual shape of a terrain.
proximity.pyWith the proximity tool, users can analyze raster data to determine allocation, direction, and proximity. Some examples include:
To learn more, visit the Xarray-Spatial homepage (Xarray-Spatial.org) and GitHub page. Bokeh
Bokeh is an interactive data visualization library for web browsers. It can display large datasets as interactive plots, dashboards and apps. It is useful for state-level GIS projects because it simplifies visual exploration and analysis of large amounts of data. Interacting with DataBokeh plots allow users to explore “what if” scenarios and engage with the data in front of them. Share DataBokeh supports simple custom plots, dashboards, and applications that users can publish within web pages, such as news articles and state resource pages. Special Use CasesBokeh is flexible and can be customized to handle specialized use cases, such as visualizing data from multiple sources and displaying meta-analysis findings. 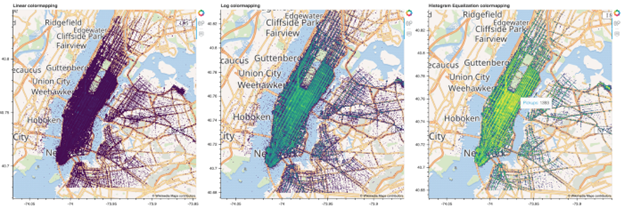 Histogram equalization for New York City/New Jersey Metro area (bokeh.org) To learn more, visit the Bokeh homepage at bokeh.org and GitHub page. |